So, this morning I gave my presentation on
Sustainability in Solid Waste Management at the
Sustainability Symposium and Expo at Brunswick Community College. I'm planning on uploading the whole thing as a PDF. But, I also wanted to do a post on some of the major points in the talk. The first section of the presentation was on trends in solid waste management in the U.S. All of the figures and data are from the EPA's
Municipal Solid Waste Generation, Recycling, and Disposal in the United States: Facts and Figures for 2009. The are numerous interesting methodological critiques available to this survey, which I may cover in another post, but it's essentially the best data available. The other nationwide waste survey is
The State of Garbage which is a joint study conducted by a great group consisting researchers fro
m BioCycle and the Earth Engineering Center of Columbia University. We can discuss the differences in a different post. Here I just want to focus on the EPA data. So, we can start with waste generation trends in the U.S.
I guess we should get terminology out to the way first. This EPA report is on municipal solid waste (MSW), which is defined for this study as:
These materials include items such as packaging, food
scraps, grass clippings, sofas, computers, tires, and refrigerators. MSW does not include industrial, hazardous, or construction waste.
Waste generation is all of the waste that ends up in a trash can, recycling bin, dumpster, and/or left at the curb. The first figure we'll look at is the trends in waste generation over the last 50 years.
The cool thing about this chart is the fact that per capita waste generation has been pretty stagnant since about 1990. There has been a downturn in the last couple of years, but one would assume that is mostly due to the current global recession. If there is less production and consumption then there is going necessarily be less waste generation. It's also interesting that total waste generation has been stagnant since about 2000. This may be a temporary stagnation due to economic issues, or it could be the end results of waste minimization efforts. Obviously, per capita generation needs to actually decrease for total generation to remain constant due to population increases. So, that's what generation has been doing, next we'll take a look at recycling.
This figure makes a lot of intuitive sense. Recycling was pretty stagnant until the mid-80's when it started to take off. This lasted until the mid-90's, when most of the low hanging fruit had been plucked (i.e., large cities and suburbs, easily recyclable materials, etc.). For the last 15 years the recycling rate has still been increasing, but at a slower rate. I wouldn't be surprised if the slope decreased again around 2007ish firstly because of the recession communities will be less likely to invest in additional recycling for fairly marginal returns, and also because most of the easy recycling has been achieved and there are fewer really attractive projects available.
Next we'll take a look at the composition of MSW in the U.S.
This chart isn't as interesting as the others, but it does tell us what's in that 234 million tons of MSW generated each year. You see that paper and fiber is the largest single component, followed by food waste and yard trimmings. All of those are organic materials that anaerobically degrade in landfills to generate methane. Some types of paper actually end up as net carbon sinks when discarded in landfills, though. We can discuss landfill carbon storage in another post, though. The next chart shows the recycling rate for a variety of materials found in MSW.
I like this chart because it's interesting to try to explain why we the variation that we do. Auto batteries are easy since a lot people get them changed at shops who typically are required by law to recycle them. They are also considered hazardous waste and contain valuable materials. Office paper is high because so many offices and such have recycling programs and people are generally good about separating it out of the trash. I would think steel cans have such a high rate because they are valuable and they are readily removed from waste streams with a magnet. Aluminum is more valuable, but eddy current separators are going to be more costly than simple magnets. Yard trimmings have such high rates due mostly to yard waste landfill bans that are in place in about half the states. I want to do a post in the future on the benefits of recycling various materials.
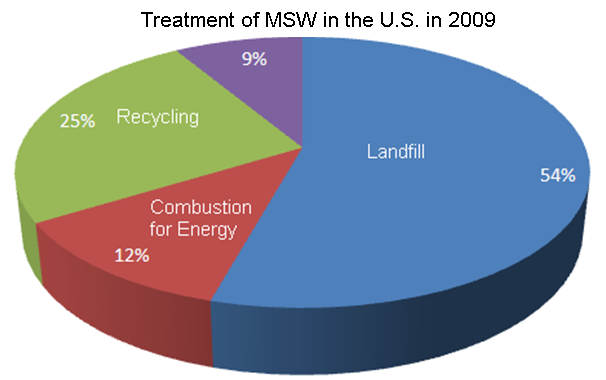
Finally, I want to look at how waste is treated in the U.S. We see that over half our waste ends up in landfills. About 25% goes to what I would call traditional recycling, which consists of turning things like metals, paper, plastics, and glass into new materials. Another 12% (the State of Garbage reports calls it 18%) is combusted for either steam or electricity generation, and finally another 9% is aerobically composted. If I had to guess based on the trends discussed earlier and some intuition, I would say the composting is probably going to increase, recycling will increase more slowly than composting, and combustion will stay about the same as landfills decrease.


No comments:
Post a Comment